Steam Traffic Patterns Deep Dive
So in a previous article I talked about the Steam Discoverability update (which I'm calling "NewSteam"). One of the big new features was a detailed traffic analysis, which Steam has explicitly given me permission to share with the public. Although we can't talk about sales except indirectly (or as a total-PC-platform aggregate), traffic is the next best thing, since traffic is highly correlated to sales.
I have no idea whether NewSteam has been positive for other developers, although it has been great for us. I've heard scattered reports that some people have actually seen their sales go down, which is distressing. So please don't take our results as representing the average developer.
In our case, we had the good fortune of participating in a few unique events that let us make some interesting conclusions.
Lifetime Stats
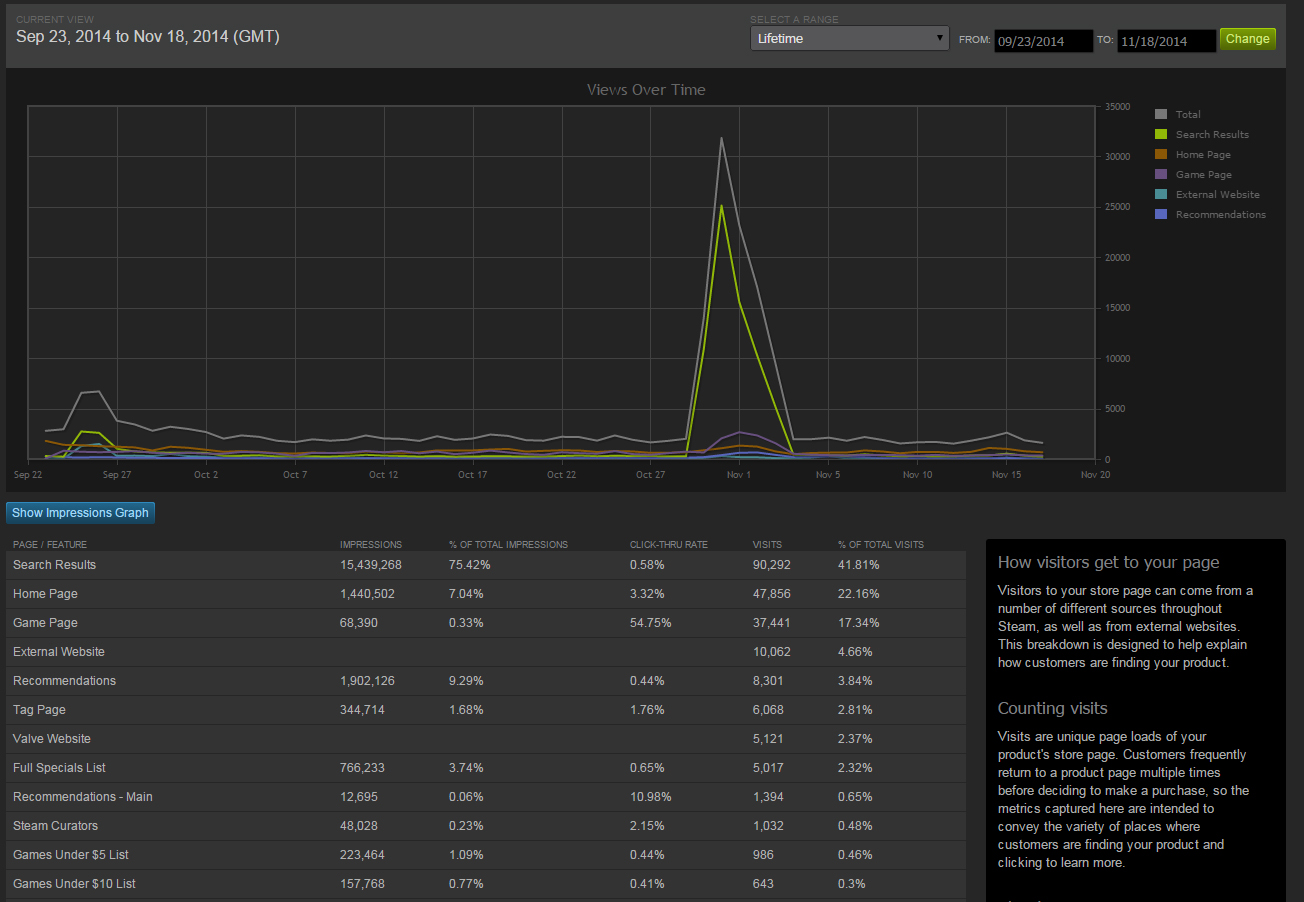
Let's start with a zoomed-out view -- here's a snapshot of all of our traffic on Steam from the launch of the traffic analysis feature until today. (The grey line is total traffic, the colors are individual breakdowns by category).
You'll notice that there's a pretty solid and steady baseline, with two anomalies -- the first small hump represents traffic from the Humble Leading Ladies weekly bundle, and the big spike is the Steam Halloween Sale.
There's also a lot of breakdowns of where all that traffic came from. As you'll soon see, the overall lifetime stats can be misleading if you don't zoom in to specific time periods first. So for now we won't analyze this exact data set, and instead just unpack what all the terms mean.
These are all the traffic categories, their biggest sub-categories, and my best guesses at what the names mean:
- Search Results : That's this page.
- Search Results : regular, "organic" search. People playing with the search engine, checkboxes, etc.
- Search Auto-complete : people specifically searching for your game by name.
- Home Page : Stuff that appears on your customized steam front page.
- Main Cluster (Recommended For You)
- Main Cluster (Featured)
- Recommended for You
- Main Cluster (Recommended For You)
If you look at your Steam front page right now, those three categories are things that look like this:


-
Game Page :
Although this has many sub-categories, for us more than 95% of it comes from just "Discovery Queue". So for our purposes "Game Page" is synonymous with "Discovery Queue." From now on in this report "Game Page" traffic will simply be referred to as Discovery Queue. -
External Website : other sites linking in to your steam page, listed singly.
- "other" (all the little sites too small for their own entry)
- Steam Gifts
- a bunch of other sites with smaller amounts of traffic (Twitter and Facebook, for instance. These were small for us but your mileage may vary).
-
Recommendations :
Like Game Page, this category has lots of subs but is dominated by just one (at least for us): "Recommendation feed - Similar by tags". So although there's other things in here (Similar by: playtime, wishlist, browsing, curator recommendations, friends, reviews, etc), we're considering this synonymous with "Similar by tags." -
Tag Page :
This has a bunch of sub-categories too (New Releases, Top Sellers, etc), but since we're getting pretty far down the list of overall traffic I don't care about zooming in further. In fact, given that Recommendations is dominated by "Similar by tags" (for us), I'm combining both Recommendations + Tag Page into one category I'm just calling Tags from now on in this report.
That leaves us with these major sources of traffic:
- Search
- Home Page
- Discovery Queue
- External Website
- Tags
Now we're ready to zoom in on the various time periods, one by one.
Vanilla Period
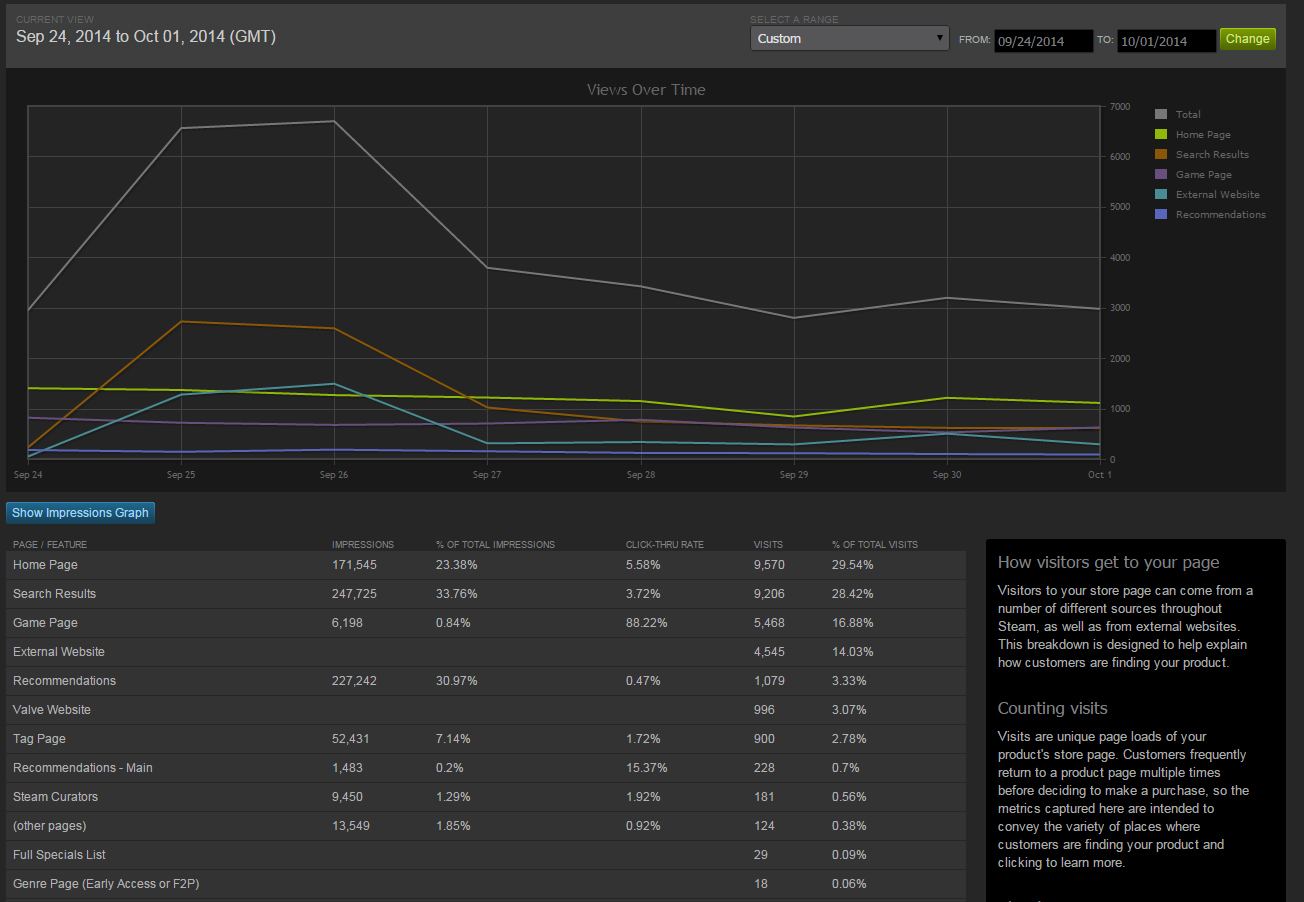
Here's a nice "vanilla" period, one full month of no major events, discounts, or significant traffic from an external site.
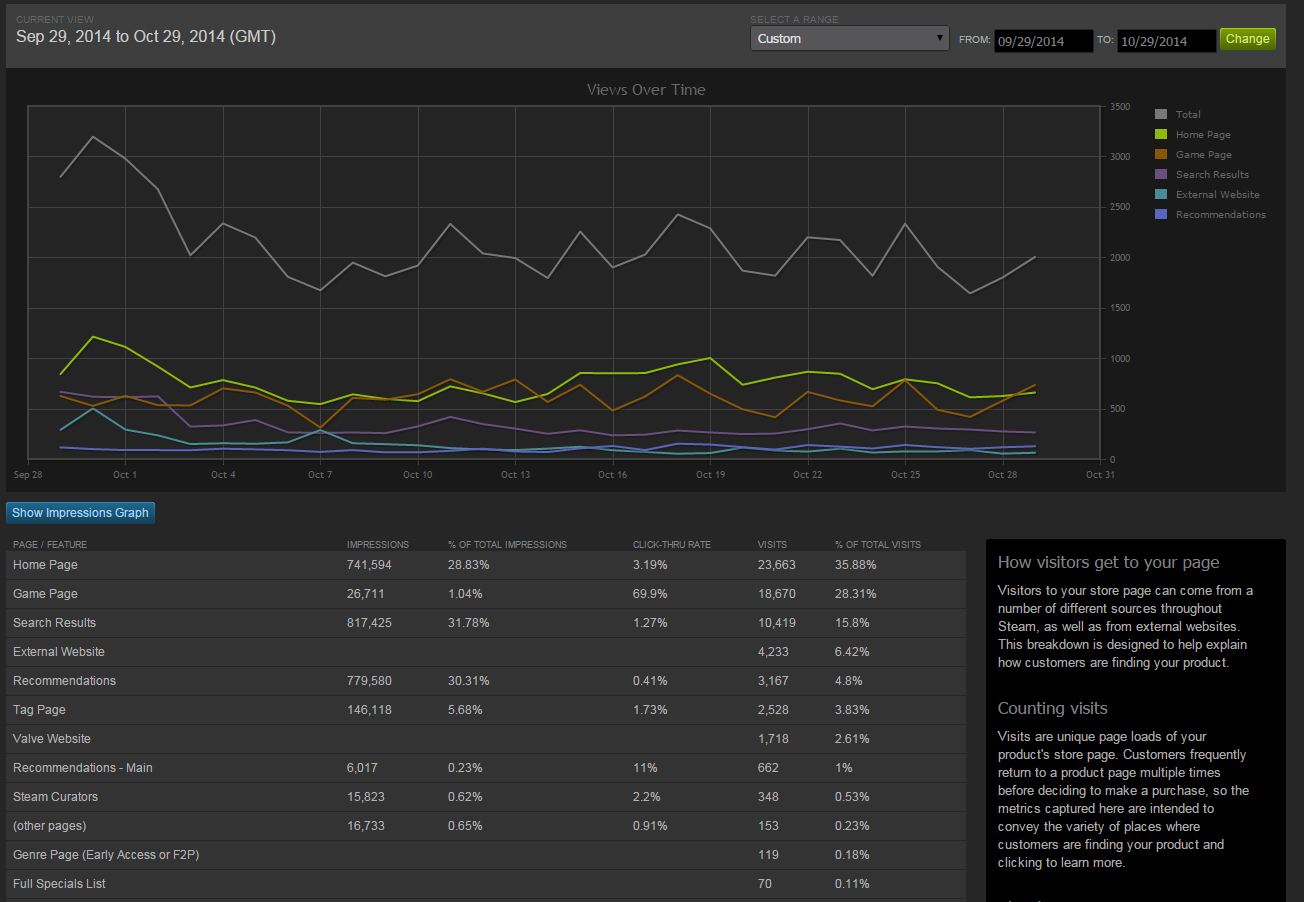
Broken down into our categories:
 1. (35%) Home Page
 2. (28%) Discovery Queue
 3. (16%) Search Results (mostly organic)
 4. ( 9%) Tags
 5. ( 6%) External Website
 6. ( 6%) Other
This is a pretty representative look at our regular "organic" traffic which comes mostly from NewSteam's discoverability algorithms. Over a third of the traffic comes from customized home page recommendations, over a quarter is the Discovery Queue, and there's a healthy dose of search results that aren't dominated by people already searching for "Defender's Quest" by name.
I can't talk about sales directly, but I think it's safe to throw out a little baseline information.We have more than 2x unit sales and more than 7x gross revenue after NewSteam, (comparing the post-NewSteam "Vanilla" period to the immediately previous "Vanilla" period).
As for the discrepancy in 2x sales vs 7x revenue, it looks like our pre-NewSteam "Vanilla" period was dominated by sales from Russia and Ukraine, where game prices are lower.
I have no data on what our traffic patterns were like pre-NewSteam, but given the change in sales it's probably safe to assume pre-NewSteam traffic was a fraction of what we're seeing now. Surely whatever traffic we're now getting from new features like the customized front page and the discovery queue would have been non-existant before.
Conclusions:
- NewSteam has significantly boosted our traffic and sales
- During "vanilla" periods most new traffic is from "organic discoverability"
- NewSteam has made us more visible in particular to Western players
Humble Bundle
Okay, that's nice. But what about the anomalies? What happens when an external promotion like the Humble Bundle happens?
Broken down into our categories:
 1. (30%) Home Page
 2. (28%) Search (mostly autocomplete)
 3. (17%) Discovery Queue
 4. (14%) External Website
 5. ( 6%) Tags
 6. ( 5%) Other
Here we can clearly see the influence of external traffic. Search results are a much higher share than normal, and if I peek at sub-categories Steam tells me 64% of search traffic is auto-complete (in the Vanilla period autocomplete was just 38% of total search traffic). This makes sense -- people heard about Defender's Quest on Humble, and are searching for it directly to either check it out or because they just redeemed a Steam Key.
I won't drill down too much into the other main categories, but I did notice that "Home Page" is mostly dominated by "Main Cluster (Featured)" this time instead of "Main Cluster (Recommended For You)", and Google totally dominates the external website traffic (a whopping 33% of it).
Notice there doesn't seem to be much of a knock-on effect from within Steam itself -- Home Page, Discovery Queue, and other sources of traffic stay right about where they were before. Most of the new traffic is coming externally from Humble's impetus.
Now, let's look at the Halloween Sale, in which we were prominently featured this year.
Halloween Sale
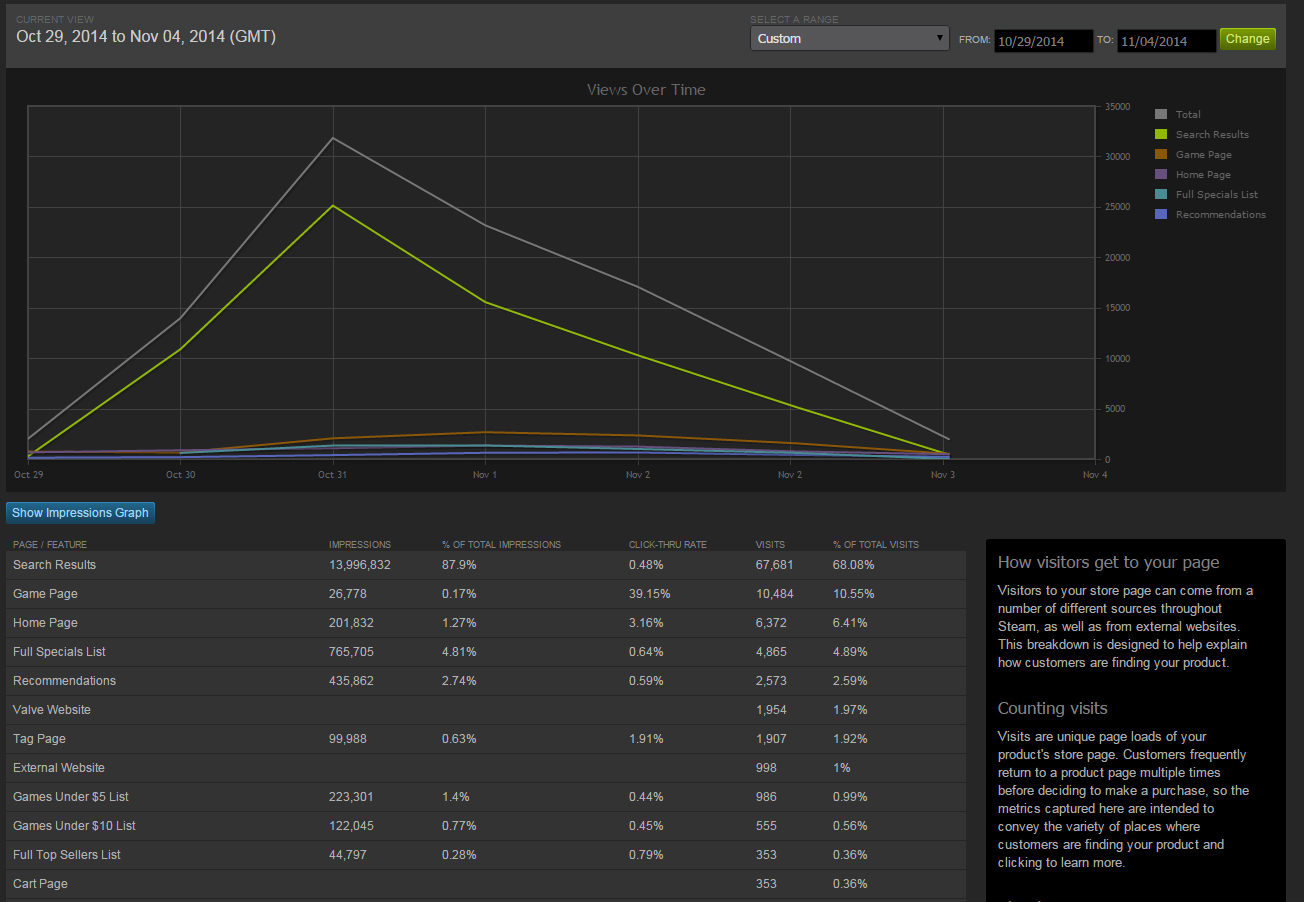
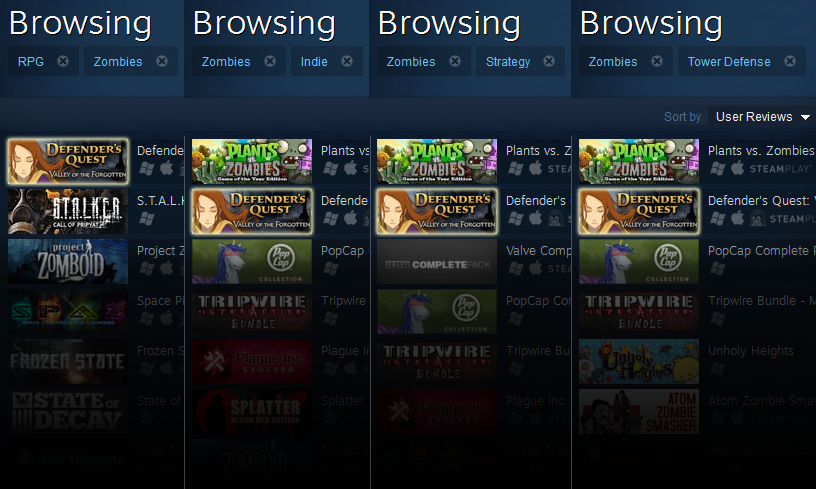
Steam piggy-backed off of the "search" page this year to make the Halloween Sale. Clicking on the Halloween Sale banner would take you to a customized search page that only included certain "Halloween" themed games, presumably hand-picked by Valve. Since Defender's Quest is the #1 highest rated Zombie RPG on all of Steam, we threw our hat in the ring, and were accepted.
Here's the results:
 1. (68%) "Search" (but really the Halloween Sale promotion itself)
 2. (11%) Discovery Queue
 3. ( 6%) Home Page
 4. ( 5%) Full Specials List (ie games on discount)
 5. ( 5%) Tags
 6. ( 5%) Other
What a difference! First of all, "search" results totally dominate, but a quick analysis shows that it's not really search results so much as the special Halloween sale page being lumped in with "search." There's no "Halloween Sale" sub-category, but an insane 98% of the search traffic is from the not-autocomplete sub-category, so the Halloween Sale is the only reasonable explanation.
We did very well on the Halloween Sale -- its default sorting was "Relevance," and we consistently ranked around places 13-15, putting us safely on the front page (Incidentally, I have no idea how "Relevance" is calculated).
Unlike the Humble Bundle, there is some knock-on effect here, which you really need to look at the lifetime graph to see:
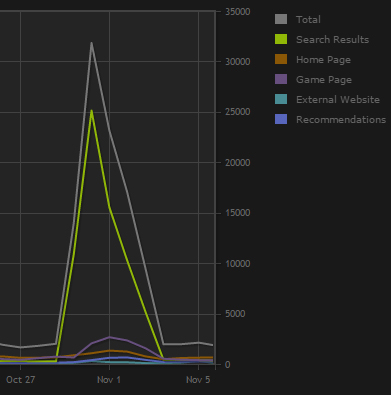
There's a bulge in Discovery Queue ("Game Page") traffic and Recommendations as well as a slight uptick in Home Page. In the previous graph, you can also see that the Full Specials List has jumped into the top 5 for the first time (I think that's this page).
The Halloween Sale results prove that the old model of "hoping someone at Valve will include you in a big featured promotion" is still alive and well alongside the new "organic discoverability" engine. That said, we don't know for sure whether our good performance this Halloween Sale (recent pre-NewSteam seasonal sales had been dismal) was at all aided by the discoverability update in the form of improved search tools, the user rating system, and other features recently emphasized. We're also in the lucky position of having a highly-rated game, which seems to do well under recent circumstances.
Another thing we can say is that unlike externally driven traffic from the Humble Bundle, increased visibility from within Steam -- such as the Halloween Sale -- does seem to bleed over into other discoverability channels, albeit not for very long. The baseline seems very stable and traffic almost immediately returns to the "vanilla" level after an anomaly.
Final Conclusions
Based purely on our own results, we can safely say:
- NewSteam boosted traffic and sales
- "Vanilla" traffic remains the same before and after Humble Bundle/Halloween Sale
- Humble Bundle drove external traffic with no visible knock-on effect on other Steam traffic
- Halloween Sale was basically a traditional featured promotion and did multiply other Steam traffic
- Having a high user rating seems to help a lot
- NewSteam seems to have increased visibility among Western players
- Curators were a completely negligible part of our traffic. (We're not curated by anyone big).
It's encouraging that even after nearly two months, the standard "Vanilla" traffic doesn't seem to be decreasing, not even noticeably dipping below the baseline after a big sale.
Your results may vary. If you have data that corroborates or undermines these conclusions, I'd love to see it!