I Wish Upon a Steam
I write about Steam a lot, because they hold my fate in their hands like a tiny bird.
(Photo by Chris Yarzab, link)
Given the recent flood of games onto Steam, I had high hopes for the long-awaited Discovery update, which introduced "organic" traffic channels such as customized home pages, improved search and tags, automated recommendations, and many other things. We recently reported on our results for Defender's Quest from the first two months. Today I'd like to add the results from the recent Autumn Sale and expand our analysis beyond simple traffic reports.
But first, a preview of our conclusions. Since the discovery update:
- Long-term "Stegosaurus Tail" sales strategies are more viable now
- There's more room for smaller games to participate in sales
- Wishlist piles are (potentially) ripe for harvesting
- Traditional hand-picked promotion still matters, and matters a lot
- There's a big uptick in revenue from seasonal sales even if you're not hand-picked for a promotion
Caveats: This is based purely only on our own results so far for a ~3 year old game, and the conclusions hold if and only if enough other developers are also seeing the same things. Until other developers share more data these conclusions remain speculative.
With that out of the way, here's the data I'm going to share that supports these conclusions:
- Wishlists
- Revenue comparisons
- Traffic Reports
Wishlists
The Autumn sale had a bunch of hand-picked front-page promotions, but also had a link to a customized sale "for you", presumably driven by the mysterious recommendation engine I've come to call The AlgorithmTM.
The custom page looked like this -- note the prominent position of games from my wishlist:
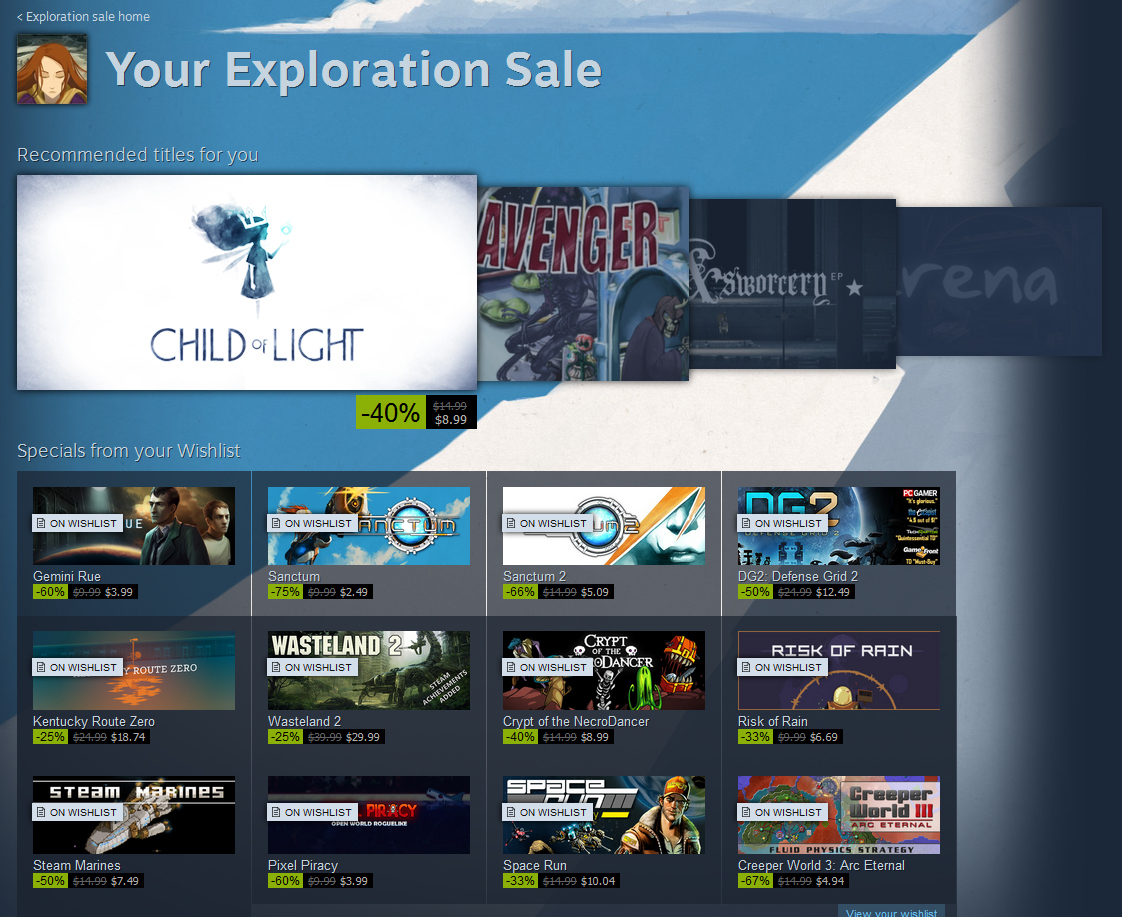
This was the first Steam sale since the Discovery update to properly integrate the new features in a significant way -- previously, all wishlists really did was notify you via email or Steam IM when those games were discounted. It seems like an obvious move -- if you have a list of games you wish to buy, and they're on discount now, and you're in the mood to spend, maybe we should put those right in front of your face?
Sounds reasonable. But did it work for us?
Steam has always given detailed sales reports to developers, but they only recently added the ability to track wishlists. Also, the tracking is still very simple -- the only data is the current day's wishlist stats, with no history or graphs. So, I made a point to write down our values before the Autumn sale to compare afterwards.
Note to Steam: Please give us historical data and graphs for wishlists!
The good news is that wishlist data has three parts -- total number of people who have the game on their wishlist, people who had the game on their wishlist but have since bought it, and wishers who have since received it as a gift. I combine Bought + Gifted in the final column as "Fullfilments." Also, because I'm not allowed to share exact sales figures, I'm expressing these all in quantities relative to X, where X = ( pre-Autumn Sale wishlist total ). So (200% X) means "twice as many wishlists as right before the autumn sale."
| Wishlists | Current | Bought | Gifted | Fullfilments |
|---|---|---|---|---|
| Before Autumn Sale | X | 100.34% X | 8.68% X | 109.03% X |
| After Autumn Sale | 97.79% X | 103.75% X | 8.77% X | 112.52% X |
| Change | -2.21% X | +3.41% X | +0.08% X | +3.49% X |
Summing up:
3.49% of wishlists were fullfilled during the Autumn Sale!
New wishlists added = 1.28% of previous total
Also, we can't share the exact figures that support this next point, but:
50%* of all units sold in the Autumn Sale were fulfilled wishlists.
*Almost exactly!
It's nice to see Steam roll out a sale that integrates targeted discovery features like this. I mean, the AlgorithmTM is supposedly looking for data to help predict what players want to buy, and a wishlist seem like a straight-up confession: "I want these games." Of course, perhaps not every single wishlist is a potential sale waiting to be reaped -- after all, the Netflix instant queue is very similar, and I have shows on there I haven't gotten around to watching in years.
Here's what Valve's Alden Kroll had to say about Wishlists in a recent email:
Some customers appear to use wishlist like a ‘save for later’ where they add a bunch of things to their wishlist during a sale and then go immediately buy some of them.Customers also remove a lot of games from their wishlist during a sale, presumably because they are reminded that they have a wishlist (and realize that they no longer really want all the things they added previously).The addition of the discovery queue drove a huge increase in customers adding games to their wishlist (I guess we also made changes to make the wishlist button more prominent, which undoubtedly helped as well). The new store roughly doubled the number of items being added to wishlists across Steam each day.
The part about the discovery queue is really interesting, because it means that a wishlist-targeted sale can be the second stage of a "one-two punch" discovery process. The discovery queue fills up people's wishlists, and the next sale harvests them. Given that 28% of our baseline traffic came from the Discovery queue (see last article), this is pretty significant for us!
Finally, it's worth noting that although the front page in the sale is still driven by hand-picked games, there's now a nice customized space that any game can occupy just by being on someone's wishlist, without having to compete all-or-nothing for the entire world's simultaneous attention. That's a big deal.
Next, let's talk about revenue.
Revenue Comparison
Last time, we analyzed the different traffic patterns experienced during the recent Halloween Sale and a baseline period (September 29 - October 29). This time, let's look at revenue. Once again, we're using relative figures, where X stands in for the revenue earned in a new baseline period (August 22 - September 22), the month immediately prior to the Discovery update, and Y is the average daily revenue from that same period.
| 2014 | Discount | Days | Revenue | Revenue/Day |
|---|---|---|---|---|
| Pre-discovery baseline1 | 0% | 31 | X | Y, where Y = X/31 |
| Post-discovery baseline2 | 0% | 30 | 403% X | 416% Y |
| Halloween | 67% | 4 | 1555% X | 12053% Y |
| Autumn | 67% | 7 | 468% X | 2072% Y |
1 August 22 - September 22
2 September 29 - October 29
Here's a visual:
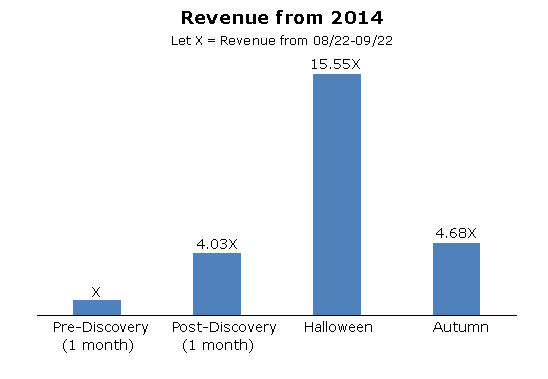
And here's what the daily values look like:
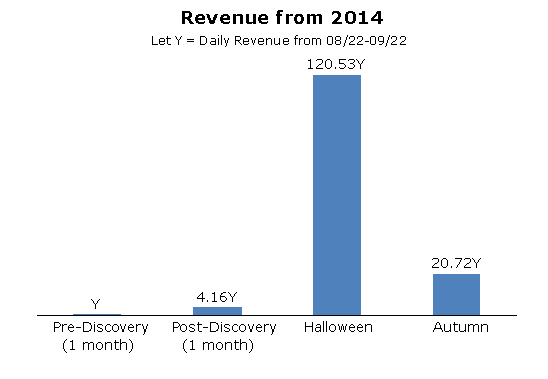
Daily revenue in the post-discovery baseline period more than quadrupled! And of course Halloween sale revenue is off the charts, but Autumn sale is pretty good too, especially considering it lasted for longer and also the fact that in Video Game years Defender's Quest is well out to pasture by now.
But are these results really the work of the Discovery update and not the natural ebb and flow of the year? Maybe there's something special about the October baseline period? Let's compare this year with last year's results for the same time periods:
| 2013 | Discount | Days | Revenue | Revenue/Day |
|---|---|---|---|---|
| 08/22-09/22 baseline | 0% | 31 | 342% X | 342% Y |
| 09/29-10/29 baseline | 0% | 30 | 186% X | 192% Y |
| Halloween (didn't participate) | 0% | 4 | 22% X | 166% Y |
| Autumn (didn't participate) | 0% | 7 | 195% X | 864% Y |
And here's the visual comparison of both data sets:
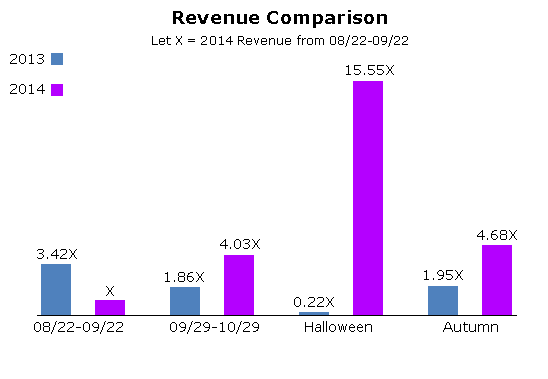
And daily values:
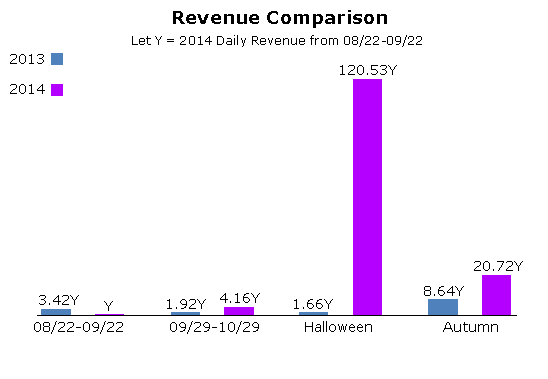
Two things convince me the Discovery update increased our sales:
- We made less revenue in the pre-Discovery baseline in 2014 than in the same time period in 2013.
- We made less revenue in the second baseline period in 2013 than in the previous baseline that year.
Point 1) is what you expect as the natural downward sales trajectory for an aging game, and point 2) reinforces that there's nothing naturally special about the October baseline period that would suddenly boost sales over the previous month. If we were seeing the same pattern as last year, sales should have gone down then, not up.
So let's go through our findings:
a) Immediately post-discovery, our baseline revenue quadruples!
And that's just from "organic" traffic! Remember, no discounts, features, or external promotions happened during the baseline, and as always we've had negligible traffic from Steam curators. This is all just algorithmic stuff!
b) There's nothing special about the month of October that would naturally increase revenue
...for the reasons stated above. This strengthens conclusion a) that the "October increase" is indeed the result of the Discovery update and not something else.
c) Every post-Discovery time period made more money than last year
...even though the game is now a whole year older!
d) This year's Halloween / Autumn sales did much better than last year
Primarily because we were actually able to participate this year! We believe that the Discovery update made it easier to be included in a sale, since "organic" features are not as scarce a resource as hand-picked promo slots, which helps to make steam sales less of an "all or nothing" game. Furthermore, organic traffic during a sale in the Autumn format is now possible, and a lot of it seems to be driven by wishlists.
e) Halloween sale suggests traditional hand-picked features still matter
The Halloween sale did best, because it most closely resembled a standard featured promotion and we were lucky enough to be on the front page of the list, hovering around spot 13 the whole time. Although it's easy to understand why we were included at all (Defender's Quest prominently features zombies and necromancers), what's not clear is why we made the front page of that list. As I mentioned in the last article, the Halloween sale wasn't as sophisticated as the Autumn sale -- it was basically just a customized search page pre-filtered with games that prominently featured ghosts, goblins, zombies, etc. Unlike the "for you" portion of the Autumn Sale which is customized for each player, everyone in the world saw the exact same Halloween Sale list (I think).
So the question is -- did we "earn" our list rank thanks to The AlgorithmTM, or did some kind soul at Steam just anchor us at lucky spot #13? I'm not quite sure. In any case, this serves as an example that the old promotion model of "hope and pray Valve puts you in the spotlight for the whole world" is alive and well.
The good news is that kind of promotion is no longer the only source of attention you can expect from Steam.
Traffic Analysis
I promised a final traffic analysis, so here we go. This is what our life-to-date traffic chart looks like. (Well, since the beginning of Steam traffic reports right after the Discovery update, at any rate).
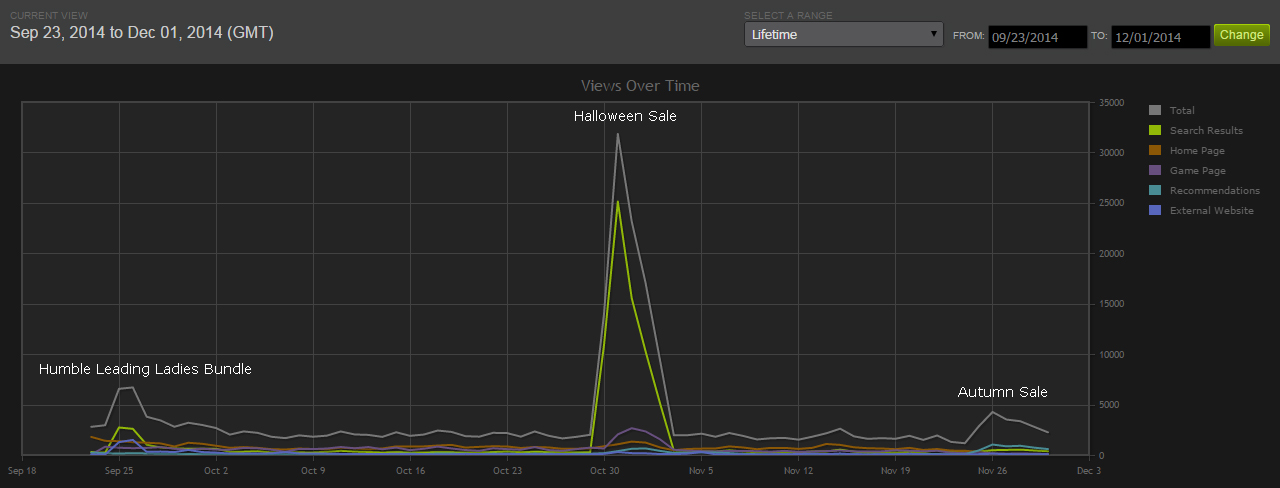
I've already reported extensively on every bit of it except the Autumn Sale, and life-to-date traffic stats would be overwhelmed by the Halloween spike anyways, so the only thing left that's worth looking into is the Autumn Sale period.
Let's zoom in:
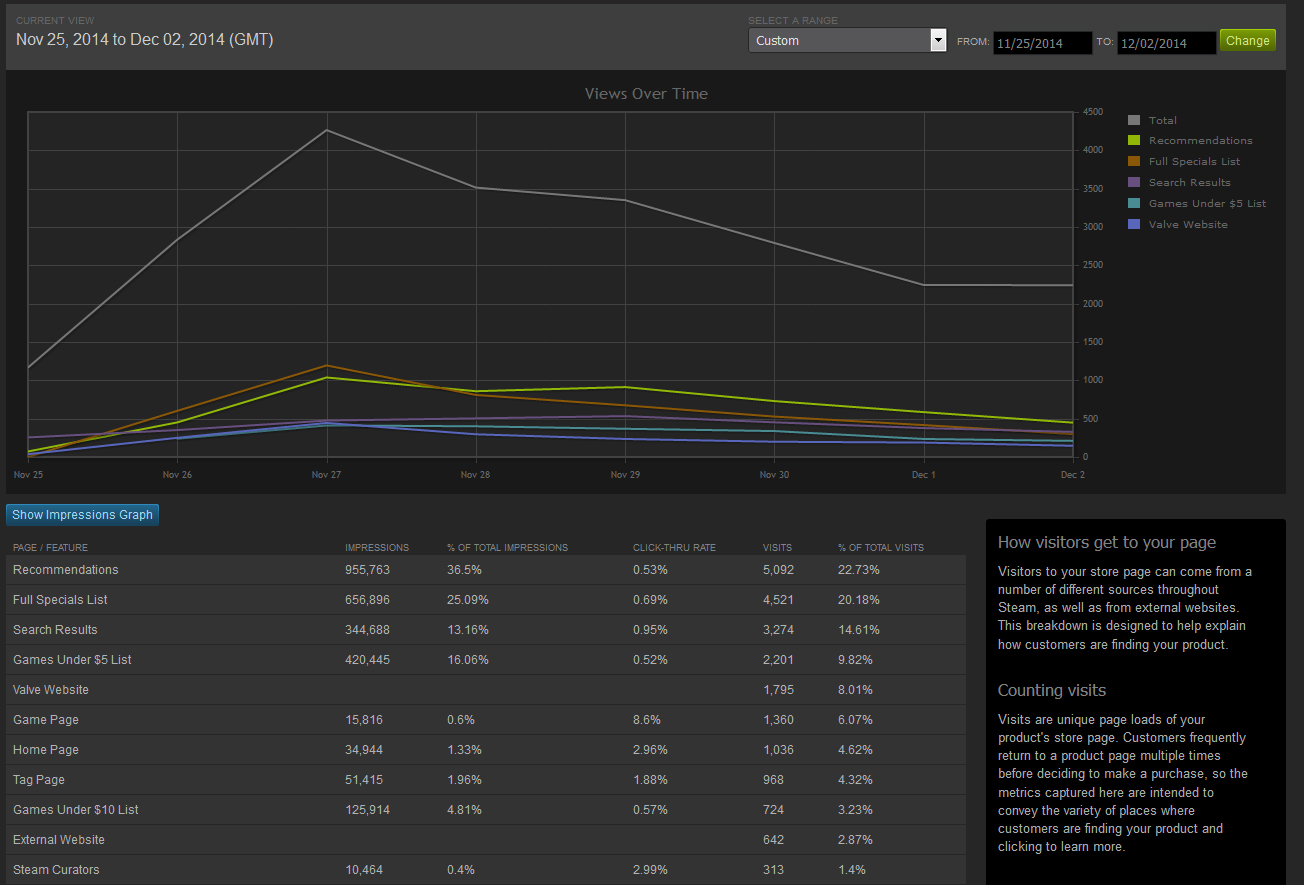
I've broken everything down into more useful categories of my own devising, just like last time.
Note to Steam: please create a separate "Discovery Queue" section rather than grouping it in fragmented sub-sections under Recommendations, Game Page.
1. (20%) Recommendations
2. (20%) Full Specials List
3. (15%) Search
4. (10%) Games Under $5 List
5. ( 8%) Valve Website
6. ( 7%) Tags
7. ( 5%) Home Page
8. ( 5%) Discovery Queue
9. ( 3%) Games Under $10 List
10.( 3%) External website
11.( 1%) Steam Curators
Recommendations is dominated by "(various features)" and "Featured Products". Search Results has a low autocomplete sub-section (3.87%), indicating fresh organic search rather than a bunch of folks already looking for "Defender's Quest." "Games Under $5 List" gets a whopping 10% of total traffic all by itself (if you combine it with Games Under $10 it's 13%!) -- which means it was smart of us to strategically discount at sixty-seven percent off rather than just sixty-six -- the former yields $4.94, whereas the latter yields $5.10.
Free Tip: If you're discounting close to the magical $5 USD and $10 USD price points anyways, you really owe it to yourself to go just under so you can make these lists! That said they aren't a huge portion of overall traffic so it's probably not worth diving down from, say, $7.50, if you weren't going to do it otherwise.
"Valve Website" doesn't tell me much because the only subcategory is "steamcommunity.com", and the rest of the categories are also-rans that aren't too important. I've extended the list all the way out to 11 just to emphasize how very little traffic we get from Steam Curators -- the feature that got the most press attention when the Discovery update launched. Curators are a complete after-thought for us, we're much more interested in the organic traffic sources. Then again, if TotalBiscuit, Jim Sterling, or Rock Paper Shotgun want to put us on their lists, I'm not going to complain...
Anyways, what's most interesting about the Autumn sale traffic is that it looks nothing like our usual baseline traffic:
 1. (35%) Home Page
 2. (28%) Discovery Queue
 3. (16%) Search Results (mostly organic)
 4. ( 9%) Tags
 5. ( 6%) External Website
 6. ( 6%) Other
And it looks nothing like the Halloween Sale:
 1. (68%) "Search" (but really the Halloween Sale promotion itself)
 2. (11%) Discovery Queue
 3. ( 6%) Home Page
 4. ( 5%) Full Specials List (ie games on discount)
 5. ( 5%) Tags
 6. ( 5%) Other
Unlike Halloween, which was basically just big sales driven by being lucky enough to be at the top of a big list, our Autumn sale results seem to have been driven by a much healthier mix of organic traffic -- recommendations, search, the specials list, games under $5 and $10, etc. Sure, we didn't top Halloween, but we made about 30% as much, and all without having to rely on a hand-picked promotion to drive the traffic.
I'm calling that a big win.
Summing up our conclusions:
- Long-term "Stegosaurus Tail" sales strategies are more viable now
- There's more room for smaller games to participate in sales
- Wishlist piles are (potentially) ripe for harvesting
- Traditional hand-picked promotion still matters, and matters a lot
- There's a big uptick in revenue from seasonal sales even if you're not hand-picked for a promotion
And the requisite caveats:
- This is just one data point
- This is just one game
- Our game is rated "Overwhelmingly positive"
- The AlgorithmTM may favor games that lots of people have already played (ie old ones)
- Your mileage may vary
At least for us, the future of Steam post-Discovery update looks bright.
What are your results?