Steam Discovery 2.0, Stegosaurus Tail 2.0
Our game Defender's Quest will be five years old in just a few days, which is a good opportunity for a retrospective on how Steam has changed in that time.
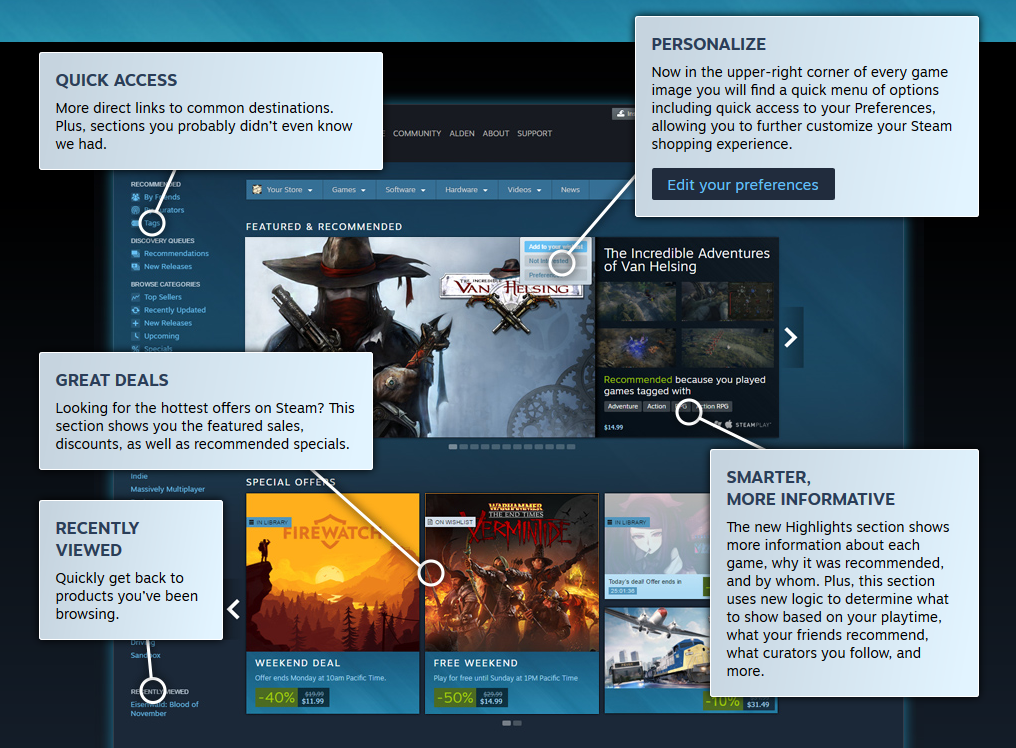
On November 8th of this year, Steam launched its much anticipated Discovery update 2.0.

I've written previously about the earlier Discovery update 1.0 here.
Discovery update 2.0 has only been out for about a month, so it's hard to precisely measure what effect it's had, but we've now got plenty of data on the effects of Discovery update 1.0. As you can see, we've got a "Stegosaurus Tail" chart -- a long tail with spikes:
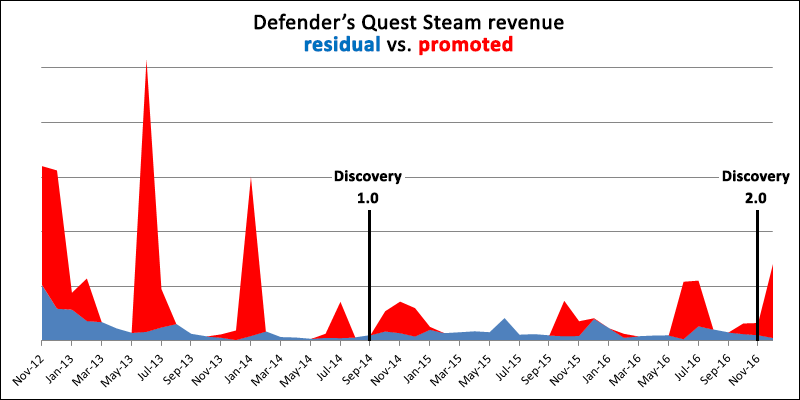
This chart shows our monthly gross revenue from Steam since we launched there in late 2012 (Defender's Quest originally launched off-steam in January 2012, selling direct and via web game portals like Kongregate). I've broken the revenue into two categories stacked on top of each other -- promoted, and residual. Promoted means anything tied to a sale, major event, or anomalous source of external traffic, and residual is everything else -- the basic revenue your game gets by random users finding your game on Steam without any special force pointing them towards it.
Our early sales spikes were dominated by hand-picked features -- things like Steam's Daily Deal, a spot in the front-page capsule rotation (back when they showed the same games to everyone in the entire world at once), and the guaranteed launch promotion that each game used to get back when there were less than 2,000 on all of Steam. This was a privileged position to be sure, and it couldn't possibly last. We were one of the very last games allowed onto Steam before Steam Greenlight unleashed a torrent of changes.
Not only did competition for promotions escalate, organic sales dried up as the catalog became too big for players to browse. We fought hard to stay afloat, but one thing's for sure -- if not for Steam Discovery update 1.0, our game would have drowned by now. We certainly wouldn't have been able to keep updating it for four years (soon to be five). As soon as Discovery Update 1.0 hit, daily sales immediately shot up. That trend has continued to this day:
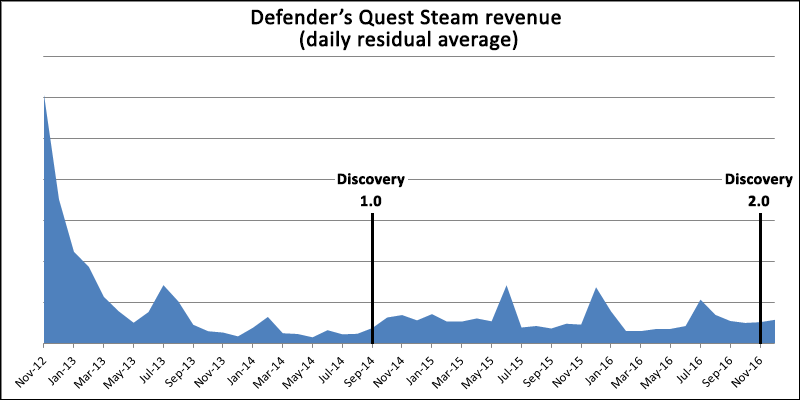
This chart shows the average daily revenue for a given month, excluding promotional periods. This gives a more accurate sense of what's coming in from Steam's daily internal traffic without any special attention shining on the game.
Residual revenue has fluctuated a bit since then, but has never returned to its historic lows in the old boom-bust days. We can see a slight upwards tick since Discovery update 2.0, but it's a little too early to say anything conclusive since we only have a month's data so far.
NOTE: In June 2016 we launched the Defender's Quest Deluxe edition update, That likely confounds data analysis a bit.
One of the consequences of Steam opening the Greenlight floodgates was that the regular seasonal promotions became major letdowns. In the early days we made a good amount of revenue from them, but as more games got onto Steam, the number of people randomly browsing to our page during the sales shrunk to nearly zero, and the sales promotion pages themselves consisted almost entirely of hand-picked features. This meant that if you weren't among the selections, you basically got no seasonal sales traffic whatsoever. And the hand-picked selections were usually big games that were already selling well. It was a bit of a catch-22.
That started to change with Discovery update 1.0.
Here's a chart from a previous article that details this phenomenon, look at the revenue comparison for the Autumn (Black Friday) sale, as well as the change in residual daily revenue:
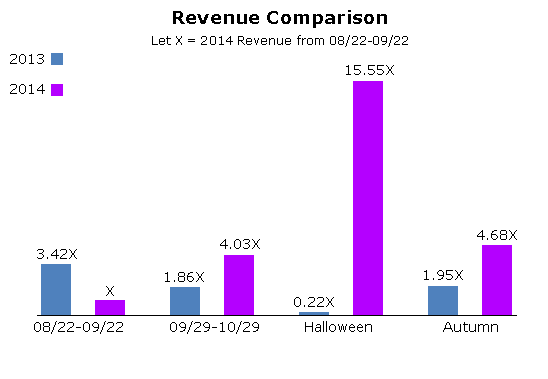
The first bar (blue) is from a residual period in 2013 and the second (purple) is from the same period in 2014, just before the Discovery 1.0 update. We see that revenue is much lower one year later. The next two bars show the effect of the udpate -- the third bar (blue) is a residual period in 2013, and the fourth (purple) is the same period in 2014, but this time the 2014 bar is just after the Discovery 1.0 update. As you can see it's not only not less than 2013, it's much greater. For a more in-depth analysis, see the original article.
You should probably ignore the spike in Halloween sale revenue in 2014 as that was largely down to a lucky fluke for us rather than any changes in the Discovery algorithm.
As for promotions and sales, around Autumn of 2014, the Discovery engine started to power the sales themselves, and Steam no longer showed the same static list of big-name games to every player in the world. Instead, they customized the sales pages, surfaced items from people's wishlists, and added trading card incentives to crawl the Discovery Queue.
The upshot of all of this is that we were about to fall off a cliff in 2014 (the game was three years old after all), but the Discovery update held us steady and slowed the descent, and in this past year we actually reversed the downwards trend of year-over-year revenue:
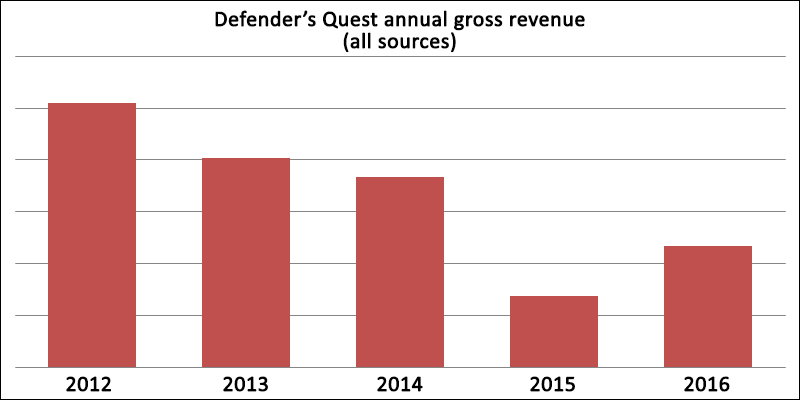
Keep in mind, this is for a five-year-old offline single-player game, with no DLC or microtransactions. Not exactly Hearthstone or Civilization V.
So how can you replicate our success? I've absolutely no idea. All I can do is list some things we did that I think were important and seemed to work for us, and try to back that up with whatever data I have available.
Visibility Rounds
Here's something that's definitely changed since Discovery update 2.0. Steam has this feature called "Visibility rounds", which used to be good for a guaranteed 500,000 "views" on the Steam front page. Everyone got a few of these, you'd spend them to bring attention to a sale or something, and people who performed well were eligible for more.
The way they used to work (near as I can figure) was to make your game appear immediately to the next 500,000 people who loaded the Steam store front page. This not only resulted in dismal click-through rates for all but the most popular, mass-appeal games, but would also cause a typical game to blow through all 500,000 views in less than a day, sometimes even within a single hour. It was a nice gesture from Valve, but didn't make much of a difference.
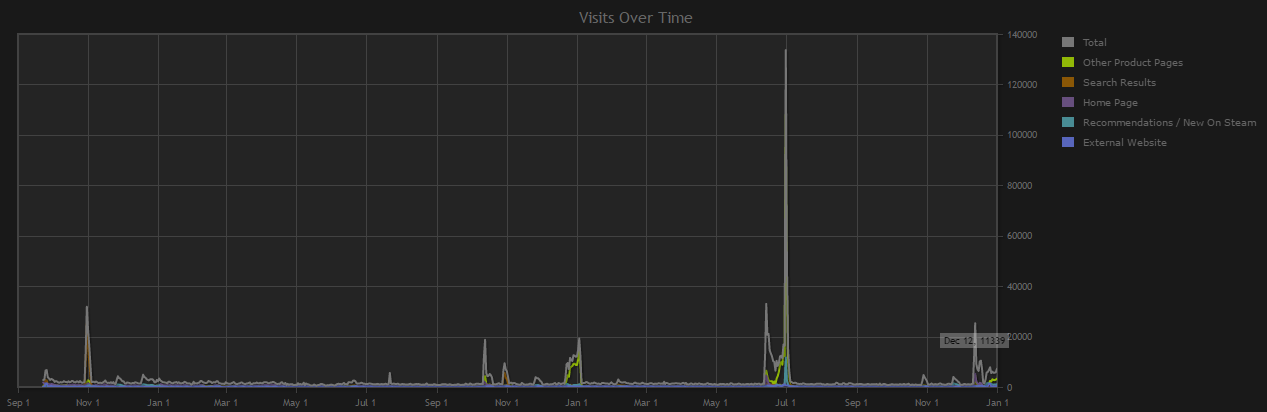
After Discovery update 2.0, this changed. Take a look:

The first two visibility rounds ran before the 2.0 update, and the last one started December 12th, 2016.
As of this writing, it's still running.
Instead of spamming a general audience as quickly as possible, the new system now strategically slow-burns your views, doling them out to people that are more likely to click through. There's a catch, however -- you're no longer guaranteed to reach 500,000 total views; it seems to just run for a month or so and you get as much as the algorithm can reach (also, the visibility update seems to pause during major promotions like the Holiday sale). At least in our case, this change was a major benefit -- with half the total views so far, we've garnered more than 4 times as many overall clicks, with a click through rate ~8.6x better than before. I've heard scattered reports from other developers about similar improvements (and complaints from one or two who have not fared as well).
Update: A commenter from reddit points out:
The main complaint for Visibility Rounds now, is that they only show major updates to game owners or people who have wishlisted the game. People who wishlist are generally waiting for a discount, and owners probably won't buy additional copies, so the net result can be very disappointing.
Crucially, they do not provide any new visibility. Nobody will see the game if they haven't already, and even then they probably won't. This means that games with small audiences will not see a benefit for supporting and updating their product using Visibility Rounds.
Your mileage may vary.
Obviously I'm biased since this one came out in our favor, but it seems like the old system was unsustainable anyways -- as more games come onto Steam, eventually the entire front page would be taken up by people cashing in visibility tokens for their guaranteed 500K views.
Speaking of views, let's look at where our overall traffic came from.
Traffic Reports
Steam added traffic reports back in 2014 along with Discovery update 1.0. Traffic data only goes back as far as the Discovery update 1.0 launch, but here's a chart of all of our lifetime traffic since then:
Broken down by category:
| Category | % Visits |
|---|---|
| Discovery Queue | 32.32 |
| Search | 18.05 |
| Home Page | 14.2 |
| Tags | 8.08 |
| External site | 6.51 |
| Specials | 5.41 |
| Valve website | 3.76 |
| Weeklong deals | 2.29 |
| Recommendations | 2.05 |
| Marketing Message | 1.31 |
| Games < $5 | 1.28 |
| Other | 4.74 |
As we can see, the #1 driver of traffic was the Discovery Queue. After that we have predictable categories like search and the customized home page, as well as tag-based recommendations. It's interesting that (for us at least), external sites drive comparatively little traffic. I'd be interested to see if this particular stat of ours is above or below average.
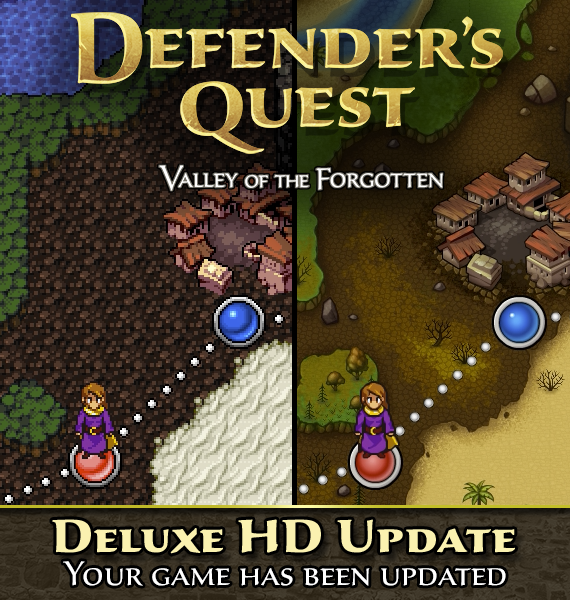
And in case you're wondering, "Marketing Message" is the little ad window that launches with Steam, we had one of these for our DQDX launch:
Next, let's zoom in on a couple of key periods so we can better understand where Steam traffic comes from.
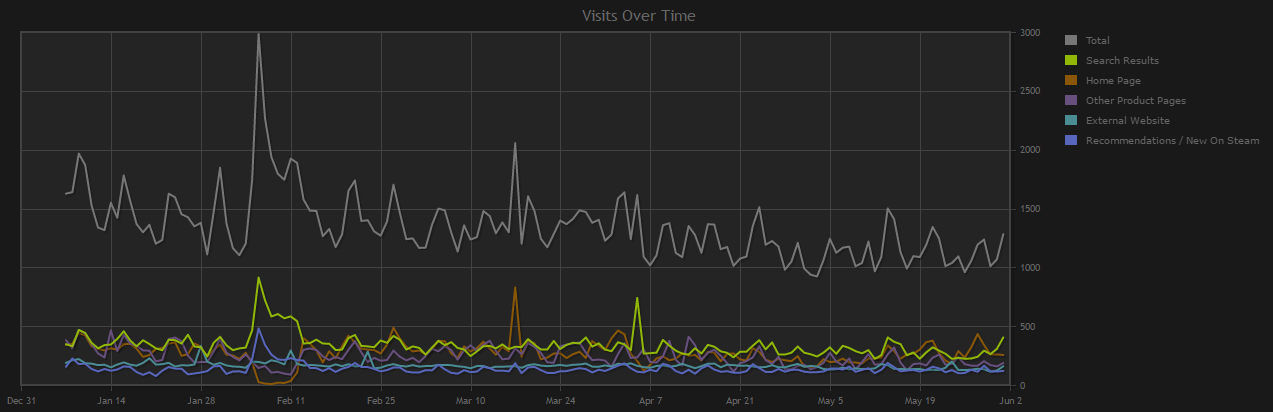
Here's a window of the promotional wasteland between January and June 2016, which represents a pretty typical period of purely residual post-Discovery 1.0 traffic.
| Category | % Visits |
|---|---|
| Search | 25.27 |
| Home Page | 20.14 |
| Discovery Queue | 15.67 |
| External site | 12.26 |
| Tags | 11.01 |
| Recommendations | 3.41 |
| Valve website | 2.81 |
| Specials | 2.44 |
| Steam Curators | 0.92 |
| Games < $10 | 0.4 |
| Games < $5 | 0.25 |
| Weeklong deals | 0.17 |
| Other | 5.24 |
The Discovery Queue is still important, but during this "non-promoted" period we see that the #1 way people are finding the game is through the Steam search feature, followed by the personalized recommendations on their home page. There's also more external site traffic (the vast majority of it simply classified as "other"). Since no deals are going on, traffic from deal-related categories are much smaller (apparently some residual traffic will leak through even from long-expired deals because of people leaving browser tabs open and reloading those pages).
TotalBiscuit
Now, let's zoom in on the big DQDX launch. Not only was the DQDX launch a success, we were also featured by TotalBiscuit in his "After Hour" segment!
Here's the traffic from that time period. The TotalBiscuit spike is visible on the right:
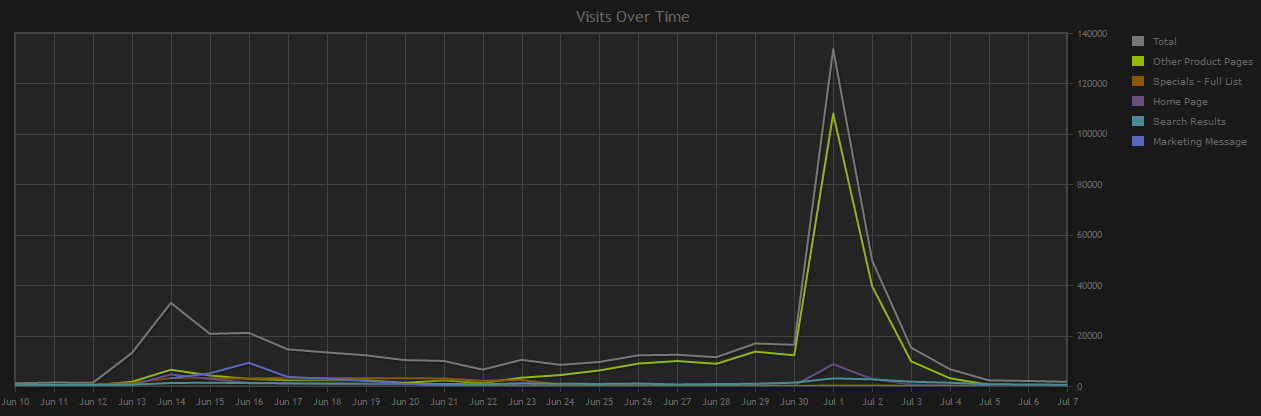
The breakdown here is:
| Category | % Visits |
|---|---|
| Discovery Queue | 61.03 |
| Marketing Message | 5.76 |
| Tag Page | 4.32 |
| Weeklong Deals | 4.07 |
| Home Page | 3.12 |
| External Site | 2.76 |
| Valve Website | 2.27 |
| Recommendations | 1.37 |
| Games < $10 | 0.71 |
| Other | 7.56 |
Man, look at that Discovery Queue! It dwarfs everything during the Defender's Quest DX launch. Nothing else even hits two digits!
Now, something weird is going on here. I absolutely know for a fact that spike was directly caused by TotalBiscuit because the timing perfectly coincides with the video and it occurred right when we would normally expect sales to be tapering off. However, it doesn't show up in the traffic report, at least not directly. Expanding "External Site" doesn't even show Youtube as a source of traffic -- the top category is simply "other."
I asked my Valve contact, Alden Kroll, about this mystery and got this response:
We’re taking a look. We’re pretty sure that the traffic and sales from Total Biscuit resulted in enough of a surge that our Discovery Queue system decided that something exciting was happening with your game and thus worth showing to more people. This happened during the sale when many folks were being directed through their Queue, so you got a lot of traffic that way.
Also, if you look at “External Website” traffic on the traffic page, you’ll see “other” as the major subcategory. I believe that is because we’re giving credit to bit.ly for the referral rather than youtube (and we don’t have a friendly name for bit.ly in our system, so it shows up as “other”).
The stats confirm this:
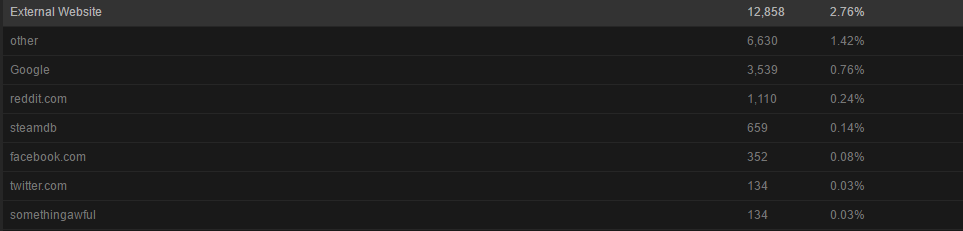
According to TB himself, the bit.ly link in the video's description had garnered 2.2k clicks as of July 4, 2016.
So that experience clued me into a really interesting observation -- even in the presence of a heavy hitter like TotalBiscuit sending you a traffic spike, the vast majority of the resulting Steam Traffic is generated internally.
All in all, the TotalBiscuit spike was responsible for about ~16% of 2016's total revenue. Definitely a huge and very welcome boost! Of course we should keep a few things in perspective:
- The attention from such a bright spotlight fades just as suddenly as it appears (traffic reports back this up).
- Even TB is not going to double or triple your revenue, as some developers seem to expect. (Also, he's a critic and it's not his job to make developers like me earn lots of money).
- As TB himself mentions in the video, he'd actually "been meaning to get around to play this game for years, but games slip through the cracks" and the DX edition update was the perfect opportunity to re-catch his attention. This particularly illuminating segment demonstrates exactly how flooded the inbox of a major Youtuber like TB can actually get.
December
We had a really good finish to 2016. Let's zoom in on the last part of the year, which is all post-Discovery update 2.0 traffic; unfortunately it's not possible to draw too many conclusions about the update's effects here because this period is so short and it's dominated by traffic from promotional events that make it difficult to directly compare to anything else that happened this year.
But let's try!
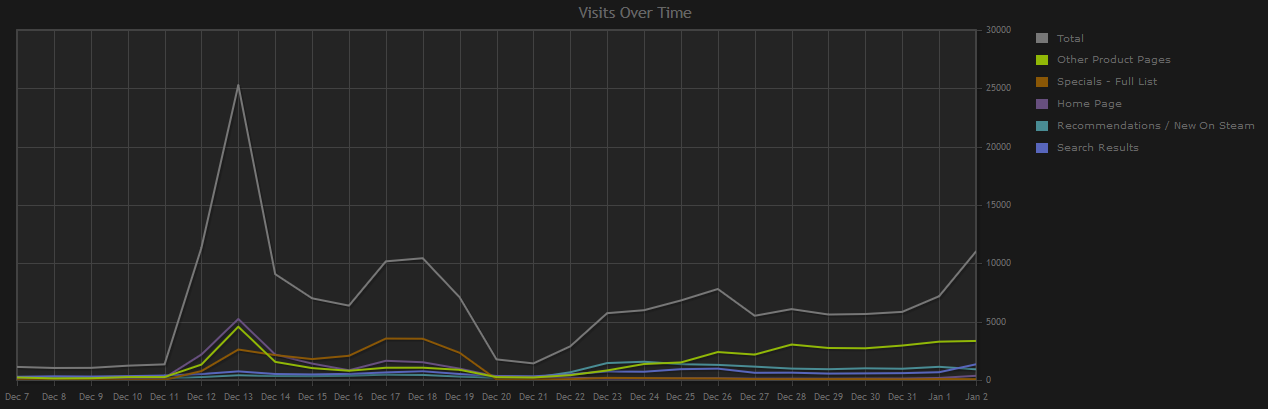
| Category | % Visits |
|---|---|
| Discovery Queue | 23.47 |
| Tags | 14.3 |
| Specials | 11.73 |
| Home Page | 10.62 |
| Search Results | 9.15 |
| External Website | 7.89 |
| Weeklong Deals | 6.98 |
| Valve Website | 5.29 |
| Games < $5 | 3.05% |
| Games < $10 | 1.64% |
| Other | 10.52% |
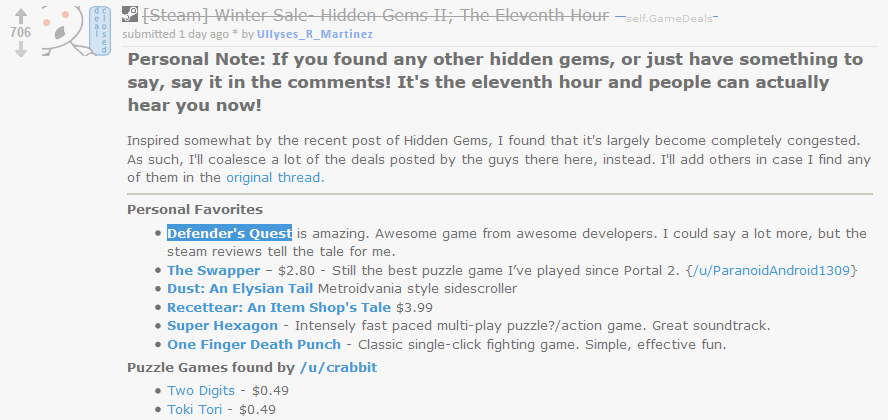
The only thing anomalous is that big share of "external website" traffic. Cracking open the breakdowns, I see that nearly half of it (3.77% of overall traffic) is attributable to "reddit.com." Hopping over to Google Analytics reveals this eleventh-hour winter sale 2016 post. Thanks Ullyses_R_Martinez!
Discovery Queue is back on top, but it's not nearly as out of control as it was during the Total Biscuit spike. In fact, during this end-of-year promotion period (which covers a self-serve sale, a spent visibility token, and the Holiday sale) we see a wide spread of organic discovery channels.
I do not have enough data for a conclusion, but I do have enough for a hypothesis:
- Discovery Update 1.0 helped smaller games with daily organic residual traffic
- Discovery Update 2.0 helped smaller games with big seasonal sales
If you have data that confirms or contradicts this, please share it with me.
Wishlists
Over the lifetime of our game, for every 2.32 copies of our game sold or activated with a Steam Key, we had 1 person add it to their wishlist. (Wishlist ratio ~ 43% of owners). Here's some more stats:
| Deleted | Bought/Activated | Gifted | Remaining balance | Conversion Rate |
|---|---|---|---|---|
| 24 % | 33 % | 2 % | 41 % | 35 % |
So we've managed to convert 35% of everyone who has ever wished for the game, which means about 14% of our game's overall Steam owners represent fulfilled wishlists.
Here's a chart of wishlist stats over time:
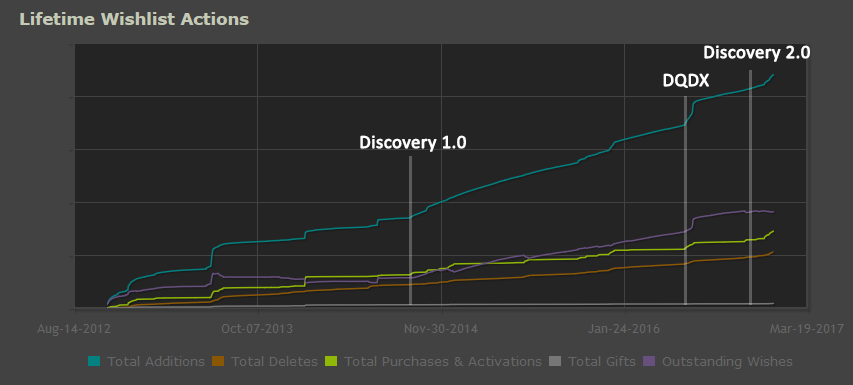
The rate of total additions starts climbing sharply in the immediate wake of Discovery update 1.0. The purchase rate seems to be fairly flat before Discovery update 2.0, climbing almost exclusively in short hops that directly correspond to high-visibility promotions and sales events. After Discovery update 1.0, however, there seems to be a larger number of smaller hops spread out more evenly, although it still seems like most people were still waiting for a sale before fulfilling their wishes.
Just glancing at the chart, the rate of deletions seems pretty steady and linear going all the way back to the beginning of the chart. Since we saw a permanent rate change for additions with the Discovery 1.0 update, and arguably some slight increase in purchases/activations, but no change in deletions, we can assume that there's been an increase in the rate of sales from wishlists since the 1.0 change.
Lastly, when the DQDX update is released we see a sharp uptick in conversions, as expected -- people were waiting for the update to buy the game, of course. And although it still might be too early to tell, there seems to be an uptick in both wishlists and conversions with Discovery 2.0, perhaps due to the new changes to visibility rounds, wishlist notifications, and wishlist-powered recommendations in the latest Steam sales. Time will tell.
Regions
Defender's Quest is fully or partially localized into the following languages:
- English
- German
- French
- Spanish
- Russian
- Korean
- Japanese
- Czech
- Italian
I'm not going to go over the finer points of localization, or whether you should localize your game or not, I covered that in Was localizing Defender's Quest worth it? Today I'll just get straight to the latest data.
Here's a pie chart of revenue for all regions over the entire life of the game:
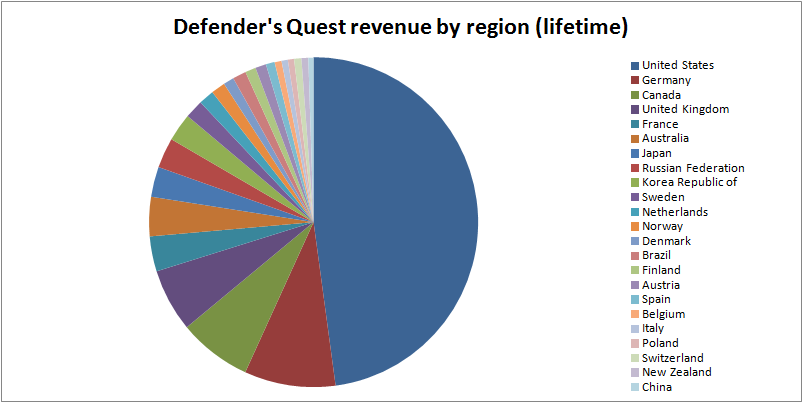
The English regions (USA/UK/Canada/Australia) are a bit over half the total revenue. Let's cut out the English regions and take a closer look:
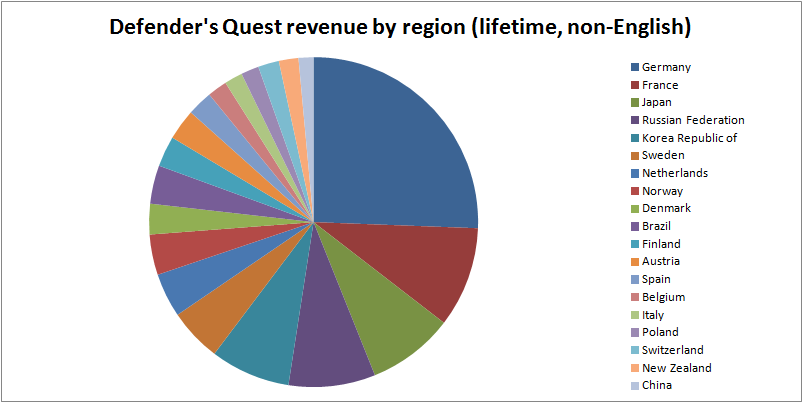
Germany is nearly a quarter of our non-English revenue. France, Japan, Russia and Korea round out the top 5 of non-English regions. Now that's not by units sold mind you, that's by revenue.
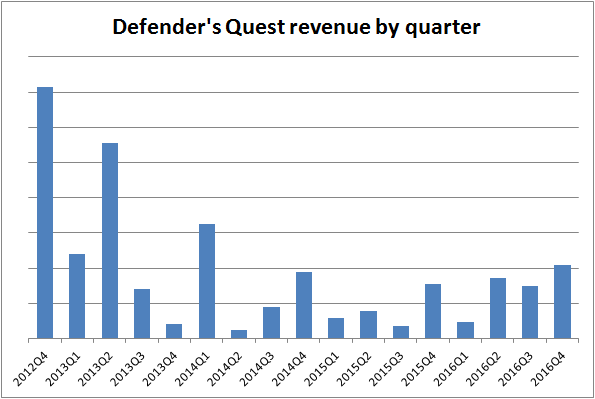
Here's all-time quarterly revenue for all regions combined as a baseline:
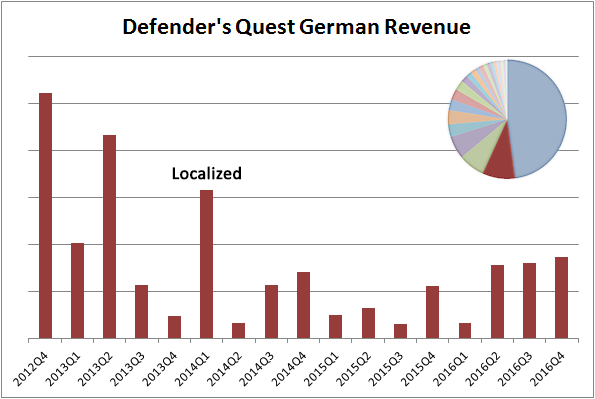
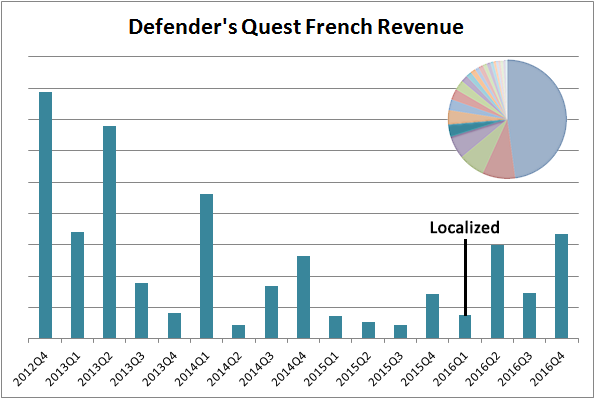
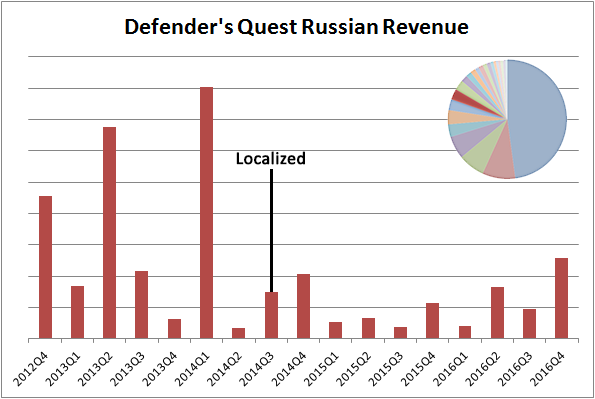
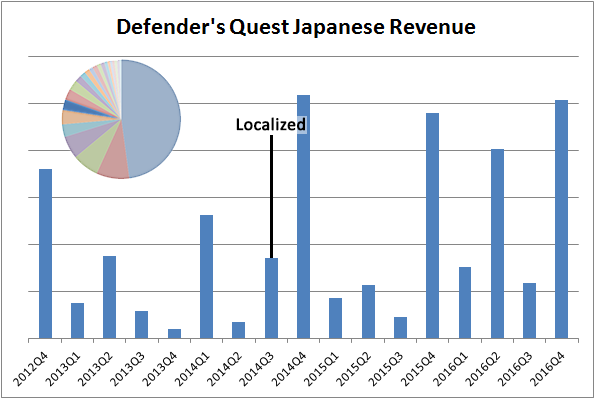
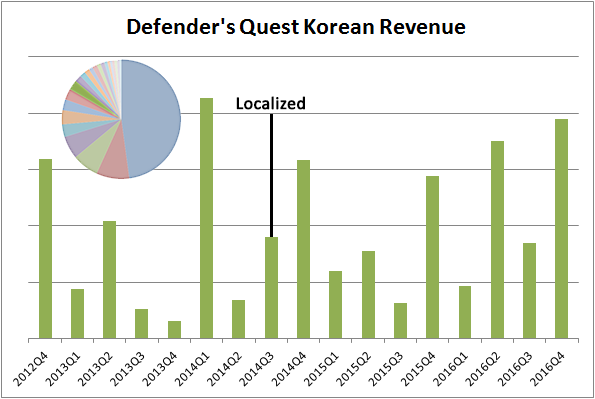
Breaking out a few key regions we start to see some interesting trends. Here I'll show some charts of just the revenue from the given region, with an overall regional revenue pie graph for context, and a note indicating in which quarter the game received a localization:
German and French, our two big European regions, seem to mostly track the English behavior:
Russian seems similar but seems more price sensitive and hugs the spikes:
Japanese and Korean are where we start to see surprises. Whereas plenty of Germans, French, and Russians were happy to buy the game in its first two years, it wasn't until after Defender's Quest was localized into Japanese and Korean that we started to see significant attention from Korea and Japan. Although it's logical that Asian countries would be more sensitive to localization given the smaller number of English speakers and the much stronger preference for their own native languages than we see in Europe, this conclusion is slightly confounded by the fact that Steam itself has been steadily expanding into Asia around this time with features like local currency support and better client localization.
Chinese is really interesting. Defender's Quest is not localized into Chinese at all, and yet:
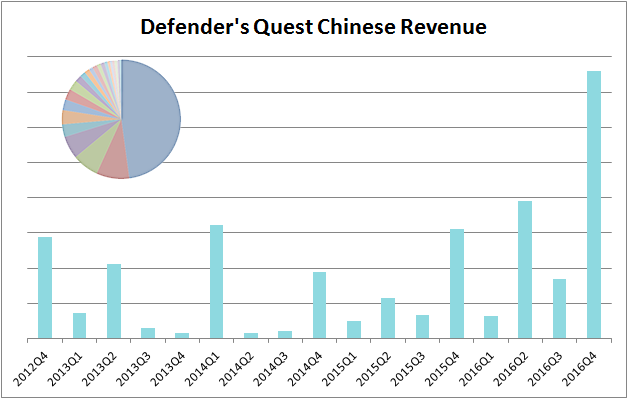
Recently, I've also started seeing comments like this pop up on my game's Steam page:

As I mentioned above, Steam announced at Dev Days 2016 that they are expanding rapidly in Asia:
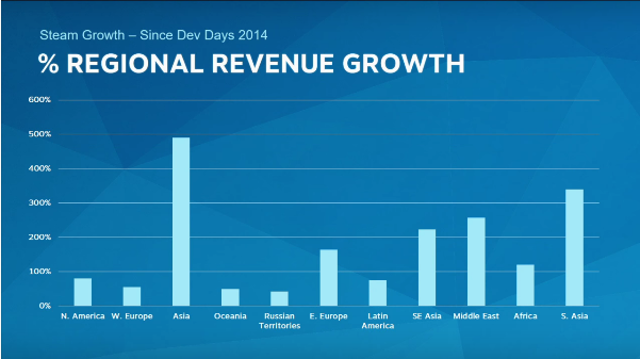
So this result is entirely consistent with that. Chinese is still a small percentage of our overall revenue, but the growth is really surprising.
Therefore, I'm already working on a small experiment for 2017 -- a partial translation of the game into Simplified and Traditional Chinese. This will cover all of the game's User Interface and gameplay text. This means the game will be entirely playable in Chinese, but the story content (about 75% of the total word count, but not necessary to play the game) will remain in English. If I see sufficient evidence that this causes the game to gain traction with Chinese players, I'll follow through with a complete translation of the story content as well.
Summing Up
So what do we make of all this?
First of all, - wow, it's really cool that it's even possible for a game like ours to have these kinds of legs. It used to be that even if you were a big hit game, you got one, maybe two months of sales, and that was it, you're done, start working on your next project. Don't bother to fix bugs or update the thing, you won't make another dime for it. I know our situation isn't typical, but it's also not unheard of these days.
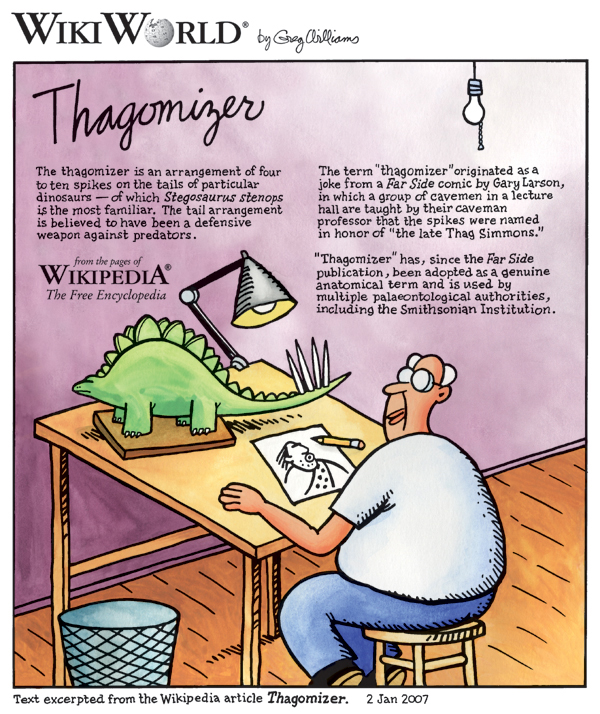
Secondly, I kind of glossed over this because this article is already drowning in detail, but a lot of those spikes on our Stegosaurus Tail could have been easily missed if we hadn't taken specific action to put them there. Many of them were tied to content updates, others were the result of being bold enough to ask for promotions (not to mention promotions and deals we did outside of Steam such as two different Humble Bundles). As a wise caveman once said, "if ya wants ta put spikes on yer Thagomizer, ya gots ta Thagomize!"
So how does one Thagomize? There's no universal rule, and the market changes every couple months. All I can say is try to be flexible and stay extremely educated on market trends. Do not disappear into a cave while you develop your game for months or years. I hesitate to give specific advice, but I can recommend the following broad courses of action:
Watch Clark Tank on Twitch

Ryan Clark, developer of Crypt of the Necrodancer, and author of this awesome Gamasutra article, has an awesome Twitch show called Clark Tank which is the place to be to learn all about the BizDev side of Indie game development.
Know your Distributor
IE, figure out what Steam is doing and see if you can "put yourself in harm's way." Is Steam pushing Workshop support? Maybe add support for it if it fits your game. Is the Steam Controller becoming a big deal? Maybe add native support and an official config. The specific examples I'm listing here aren't really the point - what's really important is learning to recognize what Steam (or whoever) wants to promote, and figure out how to naturally make your game a part of that. I'm not saying you should cynically poop out Santa Hat and Pumpkin Spice updates for every seasonal sale, just try and look for natural opportunities to hitch your wagon to something Steam's already doing.
This is much easier said than done and we come from a privileged position of having gotten in early. Your mileage may vary.
Keep your finger on the market's pulse
Check out these twitter accounts:
What's On Steam is a continuous stream of the latest games posted to Steam, so you can get a sense for what's coming out each day. The Microtrailers account is related -- it takes six one-second bites from each new game's trailer, splices them together, and tweets it. These are useful services for staying clued in to how many -- and what kind -- of games are filling Steam's virtual shelves.
You might also consider closely studying SteamSpy's glorious treasure trove of data. I would have killed for data this good when I first started out (though you should educate yourself on the statistical methods it uses and learn their limitations).
A final note: Steam Curators
I sometimes hear people complain that the Discovery update was a disappointment because the most anticipated feature -- Steam Curators -- isn't what they hoped for and seems ignored. Personally, I think it's to Valve's credit that they launch several features at once and then put the most effort behind whatever sticks. The Discovery Queue is the clear standout winner of the Discovery update, and Steam Curators are an also-ran. I'm Okay With This.
The Discovery Queue really works with what Steam is already doing in algorithmic recommendations. It surfaces a lot of interesting games I would never have found otherwise, and it harmonizes perfectly with steam sales that reward you with a trading card or two for crawling your queue.
I hear the same thing about the Steam Universe update -- people talk about how Steam Machines "flopped" and how Steam OS is "irrelevant" -- but man, have you tried the Steam Controller? While nobody was looking, it's managed to outsell all those fancy VR headsets by a wide margin and it's nothing short of a huge success. (The Steam Link also seems to be another sleeper hit that's doing well and -- hey! It runs SteamOS. How about that.)
Bottom line, as long as Steam is willing to throw Spaghetti at the wall and see what sticks, count me in for some Pasta.
Here's to another five years. Good luck out there!